Search

Super Library Marketing: Practical Tips and Ideas for Library Promotion

Category

Design

10 New Infographic Ideas To Prove the Value and Power of Your Library

Photo courtesy Cincinnati and Hamilton County Public Library

I was scrolling through LinkedIn when a post by a librarian named Kaitlyn Carpenter, who works at a high school in Houston, Texas caught my attention. She said:

“One of my favorite things that Houston Independent School District library services implemented this year has been our monthly infographics! I love digging into data and understanding trends in my library like:

  • Wednesdays are always our busiest days.
  • Ninth and 10th graders are often the most likely to visit the library.
  • Comparing how circulation fluctuates throughout the school year.”

“Infographics like these allow libraries to market to their school and district to show impact! I have made it a part of my practice to include marketing images and graphics in every weekly eNews that goes out.”

Kaitlyn knows the power of infographics

The content management company Marq.com has compiled a ton of research on the value of infographics. Among their findings:

  • About 90 percent of the information transmitted to the brain is visual. Infographics are a perfect way to turn static, boring information into visuals. And thatโ€™s important becauseโ€ฆ
  • People remember 65 percent of information when itโ€™s paired with an image. In contrast, they remember just 10 percent when they hear it or read it without an image.

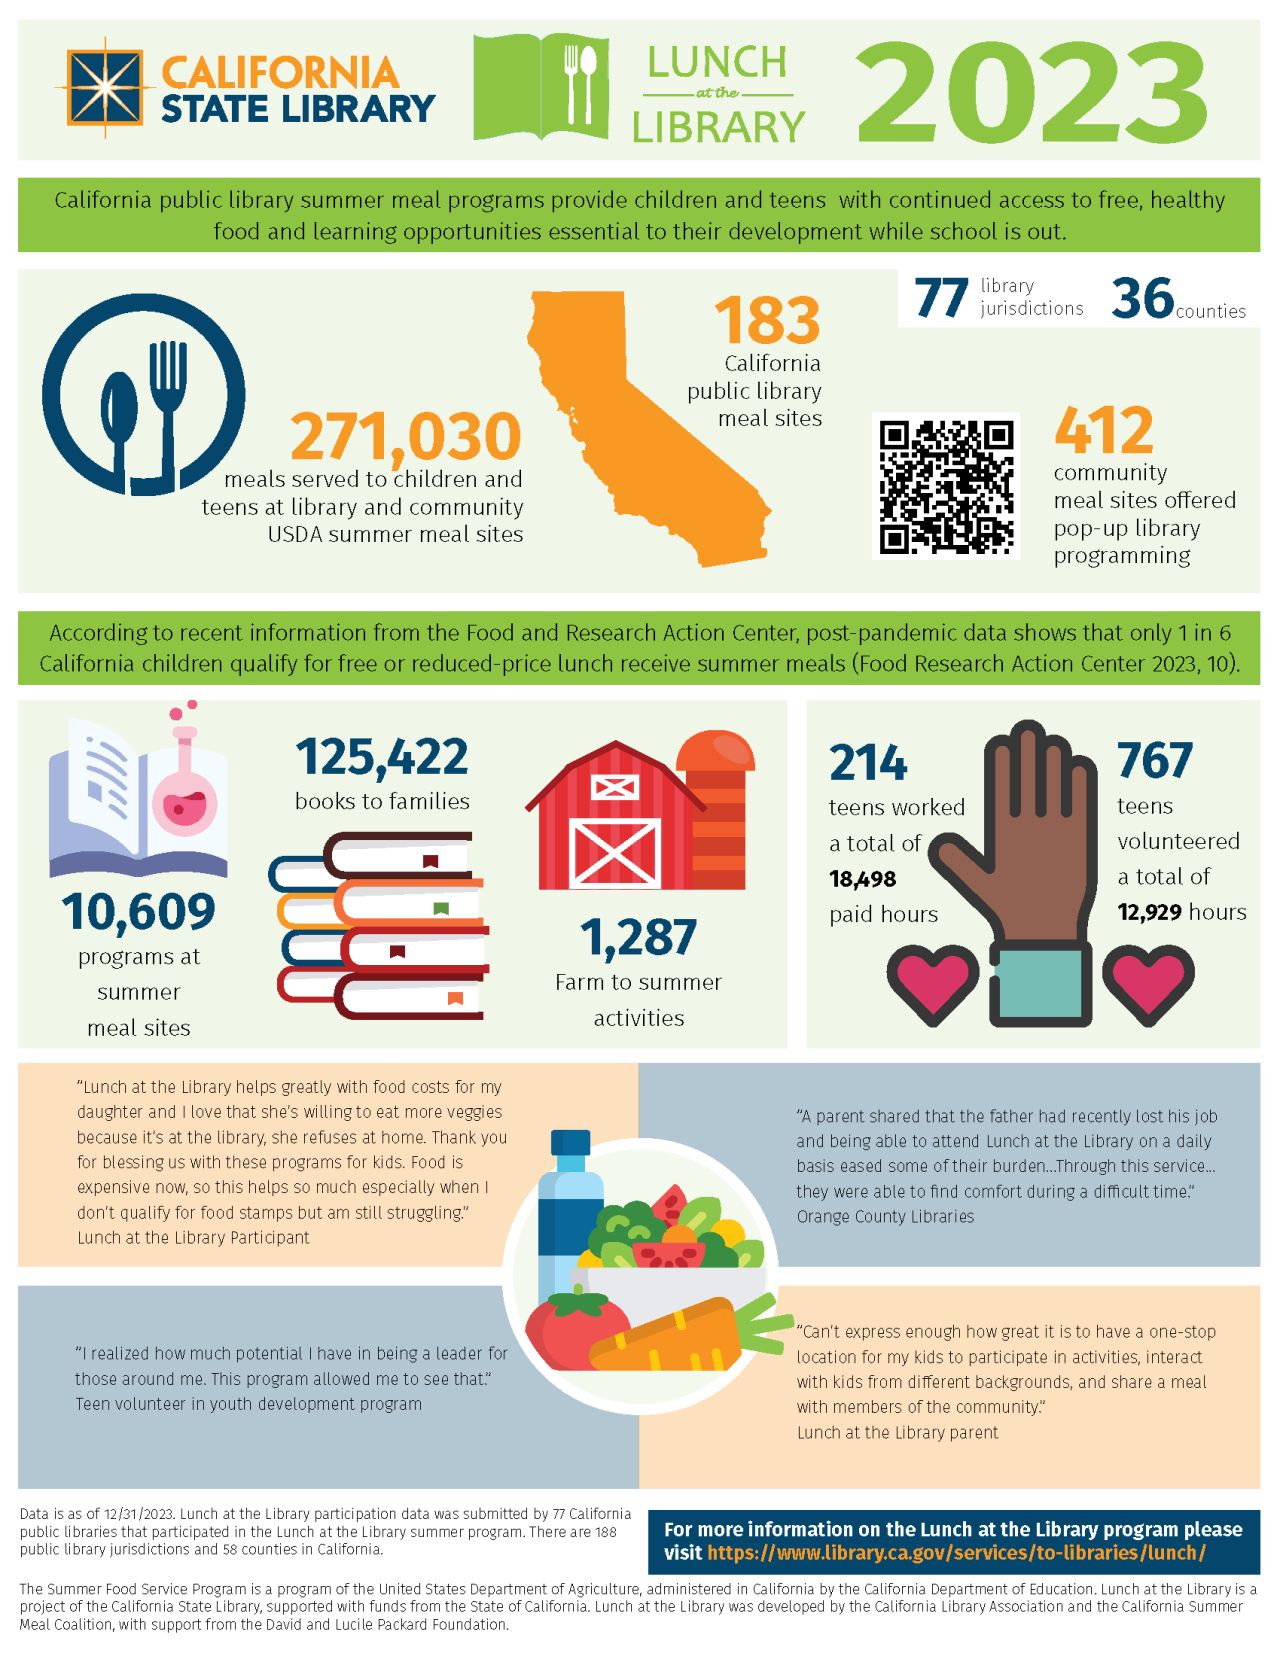
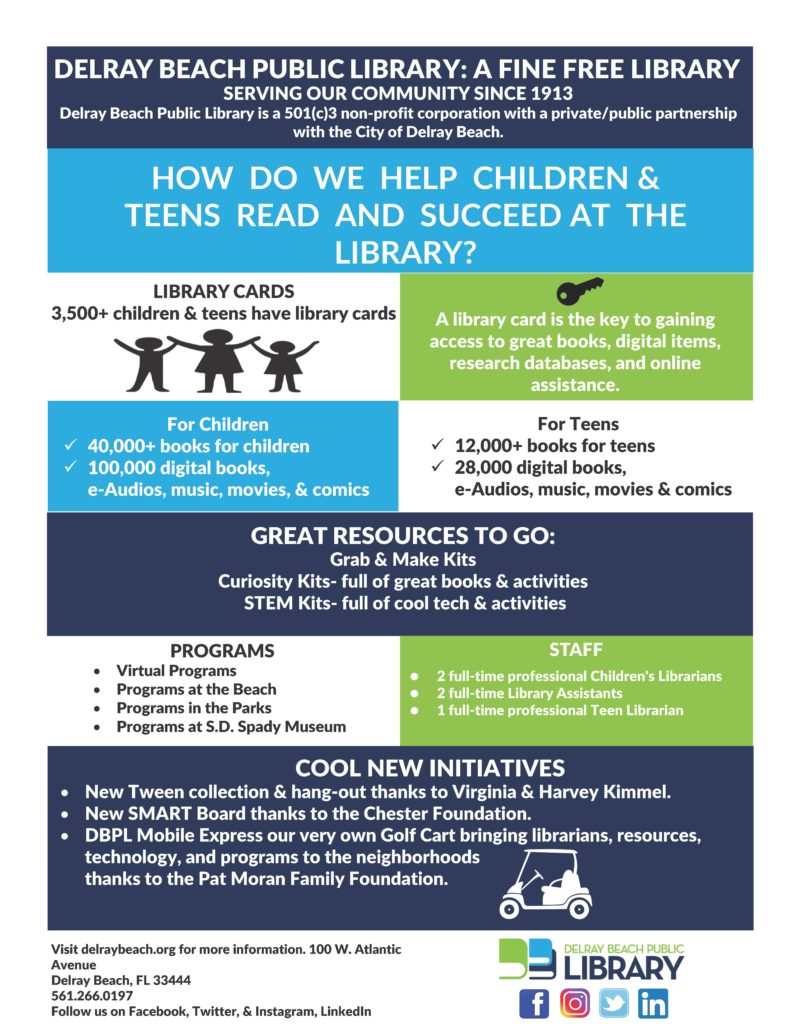
Most libraries use infographics to share statistics, like summer reading participation and impact. But your library can use an infographic to demonstrate much more than numbers!

10 innovative ways to use infographics in your library marketing

Storytelling

Use infographics to tell a story about a patron’s journey and how the library affected their life. The visuals can depict all portions of the story.

You can introduce your patron as a main character. Show the problem they face. Illustrate the solution available at the library. And then end with graphics that show how your patron’s life was impacted by their interaction with the library.

Explain Your Strategic Plan

An infographic is an engaging way to easily explain the complex information contained in most library strategic plans.

You’ll want to start with an overview of your mission and vision, followed by specific goals and the steps to achieve them. Use graphics to demonstrate the timeline for the planned work.

Here’s a great example from the Winnipeg Public Library and another from my former employer, The Public Library of Cincinnati and Hamilton County. When I worked at the library, we used this infographic to explain the strategic pillars to staff and to the public.

Testimonials and Quotes

Want to share powerful quotes about the importance of a library program or service? Include testimonials from patrons and community members in your infographic. This adds some humanity to the data.

California State Library added testimonials to their infographic explaining the impact of free lunch services.

Tutorials

We know some community members have difficulty using library resources like databases or vendor apps. (Remember how many people struggled with the Libby App?) Some members of the public may find long, text-based tutorials to be to complex.

You can turn those text instructions into a visual how-to guide to help community members ingest the information. Here’s a fun, two-page infographic from Falvey Library at Villanova University. It explains everything a student needs to know about the library as they start a new school year.

Compare and Contrast

Instead of just sharing statistics, use an infographic to compare metrics before and after library interventions. The visuals go a long way to clearly illustrating the impact of your library work.

You can also use an infographic to explain why library services are superior to other resources.

Arkansas River Valley Library System’s infographic shows the free library services that can replace paid subscription services.

Service Bundles 

Create a flowchart showing how a patron uses multiple services.

For example, your patrons may start by visiting your libraryโ€™s website, where they sign up for a cooking program. When they get to the branch to attend the program, they may pick up a cookbook from a book display. Inside the cookbook, they may find a bookmark promoting the library of things.

An infographic illustration of that patron journey helps explain the interconnectedness of library services to board members, lawmakers, and potential partners.

Delray Beach Public Library explains the interconnectedness of its services in this infographic.

Visualizing Partnerships

Use an infographic to show how the library collaborates with other local organizations, schools, and businesses. This will demonstrate how the library actively engages with the community, which builds trust and awareness. It can also highlight additional services and programs available through these partnerships.

Here’s a great example from the Tampa Bay Library Consortium explaining how the Institute of Museum and Library Services Funds help Florida library programs.

Library Accessibility

Your library can use an infographic to illustrate how the library makes resources accessible to different demographics. This includes children, seniors, and non-English speakers.

For example, if your library knows that 95 percent of seniors who attend tech skills programs learn to use tech fluently, you can demonstrate that with graphics.

Bonus tip: For accessibility of your infographic, create a downloadable alt-text document for the infographic. This allows people who use screen readers to consume the infographic. Hereโ€™s an example from EBSCO. Scroll to the bottom of the illustration and youโ€™ll see the prompt to download the alt-text version of this infographic.

Environmental Impact

Show the libraryโ€™s efforts in sustainability and green initiatives. Use visuals to demonstrate eco-friendly programs, such as recycling, energy-saving measures, and community gardening projects.

If your library has undergone a renovation or built a new building and you’re Leed-certified, use an infographic to show your community how that designation saves money and the planet.

Volunteer Contributions

Infographics easily explain the impact of volunteers on a library. The visuals can help you clearly show the number of volunteer hours. They also illustrate the types of activities volunteers assist with. Additionally, they convey the value volunteers add to the library.

Need help creating your infographic?

I am not an artist. I can barely draw stick figures. So creating an infographic is daunting to me. This post explains the process I use to plan and create an infographic.

Hey library marketing friends: I’m teaching a pre-conference workshop at LMCC this year with my amazing coworker Caleigh Haworth. It’s all about marketing your collection. Registration is open now.


P.S. You might also find this helpful

The Top 13 Places To Find Library Content To Share When Youโ€™re Tired and Overworked (Bookmark This Post!)

Subscribe to this blog and youโ€™ll receive an email whenever I post. To do that, enter your email address and click on the โ€œFollowโ€ button in the lower left-hand corner of the page. You can also follow me on the following social media platforms:

6 Simple Steps to Create the Most Important Asset in Your Library Promotional Arsenal: A Powerful Library Brand Style Guide [ARTICLE]

Photo courtesy Cincinnati and Hamilton County Public Library

Every time I see a misaligned pink square on top of blue and white plaid, my heart skips a beat.

I realize that may be the weirdest sentence I’ve ever posted to this blog but hear me out.

I am a die-hard fan of Bath and Body Works.

The bath gels, the body lotions, the candles, the hand soap. There is a scent for every season, every mood, every situation.

No, they did not pay me to say this. (But if anyone from Bath and Body Works ever reads this blog, I am willing to work as an influencer.๐Ÿ˜Š)

Bath and Body Works has a strong, recognizable brand. They don’t want you to just buy their products one time. They want you to come back, again and again. They know a strong brand style that is recognizable across all platforms is key to creating a relationship with their customers.

You want that for your library. You want your community to recognize the promotional materials you make. When someone sees a sign or a social media post or a video, you want them to know that it comes from your library without having to see your libraryโ€™s name or logo anywhere in the brand.

Building a library brand takes consistency. And to remain consistent when multiple departments and staff members create graphics, social media posts, posters, and other promotional materials, your library needs to create a brand style guide.

A brand style guide will clearly define the look and tone of marketing materials. It saves staff time. It will be used by staff when creating graphics and writing text. Most importantly, it will ensure your libraryโ€™s marketing is recognizable.

Hereโ€™s a step-by-step guide for creating your library’s brand style guide. Scroll to the bottom of this post for examples of library brand style guidelines.

Grounding statements

Begin your document by centering your libraryโ€™s brand on the guiding principles of your organization. Remind your staff of your core mission. You want to explain the importance of this work and create buy-in for your style guide.

  • Set the tone with your mission, vision, and values statement.
  • Include a sentence or two that positions your libraryโ€™s strategy, personality, and customer service principles.
  • Define your libraryโ€™s personality. Do you want people to think of you as authoritative and resilient? Whimsical and conversation? Warm and welcoming?
  • List the perceptions your library is trying to avoid, like boring, traditional, formal, or pretentious.

Logo use

Emphasize the proper use of your logo across all platforms, including print and digital.

  • Define space rules, including the use of white space in relation to the logo.
  • Set the acceptable color variations for your logo.
  • List the minimum logo sizes, including pixels, print proportions, and aspect ratios.

Colors

Your color palette is the tangible component of your brand that people notice first. Color increases brand recognition up to 80 percent. Your colors also play a significant role in how your library’s brand is perceived.

  • Include the RGB, CMYK, Hex Code, and Pantone versions of your color palette.
  • List the shades of your color palette which are acceptable for use, including those variations required for accessibility on digital screens.
  • Include color contrast requirements for print and digital screens, keeping accessibility in mind.

Typography

Like color, the fonts your library chooses are a visual cue about your brand. Your fonts should tie all communications together, from your website to print promotions. It’s important to set clear guidelines for the use of fonts.

  • List the styles, sizes, and weights that can be used. Be sure to include instructions on acceptable fonts for headers, copy, and footers or fine print.
  • Include acceptable variations on fonts, if the font is unavailable in a particular piece of creative software.
  • Set guidelines concerning spacing to maintain a consistent style when font size changes.

Tone and text

This section is important to maintain a consistent brand through all the text written for your library promotions. These guidelines will ensure people recognize the copy is coming from your library, no matter who is doing the writing.

  • Outline your preferred word and sentence length. Shorter words and sentences are easier to read and will speed up the tempo of your message. Longer words and sentences will require your audience to do more in-depth thinking but may also be more nuanced.
  • List the jargon or library terms that staff members should use. This includes terminology for how you will refer to patrons, non-cardholders, staff, branches, and your branded names for services.
  • Determine the acceptable terminology for equity, diversity, and inclusion. Set guidelines for the use of gendered pronouns, ability, and references to racial and ethnic groups within your community.
  • Set your grammar guidelines. Will you use contractions? Will you allow prepositions? What grammar rules will you keep sacred, and which can be broken?

Images

In this section, youโ€™ll give anyone creating promotional materials for your library the rules they need to find graphics, photos, and artwork that represent your library.

  • Set standards for the proper size, style, and composition of images for social media, email, digital signs, print, video, and your libraryโ€™s website.
  • List approved image sources, including a list of websites that provide free stock photos and images. Here are ten websites to help build out your list.
  • Include clear guidelines on diversity representation to ensure staff use images that accurately represent your community.
  • Incorporate guidance on the use of graphics, GIFs, and memes.

Library Brand Style Guide Examples

Does your library have a brand style guide that you’re willing to share? Email ahursh@ebsco.com and I’ll add yours to the list.


Read These Articles Too!

Call It What It Is: Toledo Public Library Explains Their New Brand Strategy

How to Pick Amazing Library Marketing Swag That People Will Love AND Build Brand Awareness and Loyalty For Your Library!

Latest Book Review

The 1619 Project by Nikole Hannah-Jones

Subscribe to this blog and youโ€™ll receive an email every time I post. To do that, enter your email address and click on the โ€œFollowโ€ button in the lower left-hand corner of the page.

Summer Reading 2022! How to Decide If Your Library Should Use Pre-Produced Graphics or Make Your Own

Watch Now

The Library Marketingโ€‹โ€‹โ€‹โ€‹โ€‹โ€‹โ€‹โ€‹ Show, Episode 126

In this episode, I’ll answer a viewer question from Victoria at the West Bloomfield Township Public Library. She asked, “Aside from the obvious budgetary considerations if public libraries use themes from a national Summer Reading organization (CSLP, iRead, etc.), is it better for us to (1) create a unique set of graphics for our library’s use that differ from year-to-year, (2) create a unique and on-brand set of graphics for our library to reuse each year, or (3) rely on the national organization’s original themed artwork as part of a unified national library marketing campaign?”

I’ll share my opinion and the 3 reasons why I came to that decision.

Kudos in this episode go to the Geauga County Public Library. Watch the video to find out why!

Do you have a suggestion for a topic for a future episode? Want to nominate someone for kudos? Let me know in the comments. And subscribe to this series to get a new video tip for libraries each week. Thanks for watching!


Subscribe to this blog and youโ€™ll receive an email every time I post. To do that, enter your email address and click on the โ€œFollowโ€ button in the lower left-hand corner of the page.

Three Design Tips For Creating Beautiful Social Media Graphics for Your Library

Watch Now

The Library Marketingโ€‹โ€‹โ€‹โ€‹โ€‹โ€‹โ€‹โ€‹ Show, Episode 108

In this episode, I’ll share three easy design tips for your library’s social media graphics.

Kudos in this episode go to the Carmel Clay Public Library for turning a vacant supermarket into a super cool library space.

Do you have a suggestion for a topic for a future episode? Want to nominate someone for kudos? Let me know in the comments.

And subscribe to this series to get a new video tip for libraries each week.

Thanks for watching!

Subscribe to this blog and youโ€™ll receive an email every time I post. To do that, click on the โ€œFollowโ€ button in the bottom left-hand corner of the page.

A WordPress.com Website.

Up ↑