Search

Super Library Marketing: Practical Tips and Ideas for Library Promotion

Tag

Social Media

The Very Latest Research on Social Media and How It Affects Library Marketing

Watch Now

The #LibraryMarketing Show, Episode 45

Angela goes over the latest study from Sprout Social which lays out the latest research on how people are using social media, plus how they view social media use by brands. The same study then compares how marketers *think* people use social media and how they view brands. The difference is fascinating, and there is a lot of great insights for libraries.

Also Kudos to the Monroe County Public Library. They released a video called “A Cautious Path to Phasing In Services” which manages to be formal and light-hearted at the same time.

What did you think of this episode? Are you struggling with marketing and promotion right now? Do you have tips for handling this crisis that you can share with other libraries? Do you have a nominee for the Kudos segment? Drop a comment below! And subscribe to this series on YouTube to get a new video tip for libraries each week!

Want more Library Marketing Show? Watch previous episodes!

This blog consists of my own personal opinions and may not represent those of my employer. Subscribe to this blog and you’ll receive an email every time I post. To do that, click on “Follow” button in the bottom left-hand corner of the page. Connect with me on Twitter, Instagram, and LinkedIn.   

Butts in Seats: Which Video Metrics Count as Attendance in the New World of Virtual Library Programming?

Photo Courtesy the Public Library of Cincinnati and Hamilton County

This week’s post is inspired by a question on the Libraries and Social Media Facebook page. A library staff member asked this: “We’re being asked to track the virtual ‘butts in seats’ numbers for each of our programs and also how many views each get in the first hour. I can’t for the life of me find that in insights.”

Analytics on views for videos, both live and pre-recorded, are measured differently by each platform. So, tracking actual attendance can be confusing and time intensive. But it is valuable data.

I have done some research this week to find updated information about how to track video views on the platforms where most libraries are posting video and doing live stream programming: Facebook, Twitter, and YouTube.

Special note: Libraries are also using Instagram for live streaming and video views. However, analytics for videos on Instagram are nearly impossible to track. My advice is limited by that fact.

What counts as attendance?

Before you begin analyzing video views on any platform, you’ll want to establish what will count as attendance to a virtual programming. It may be easiest to align your library’s definition of what counts as video attendance with the way each platform measures a video view.

Most platforms based their metrics on someone viewing a very short portion of your video, not the whole thing. That sounds like good news. But, like an email open rate or a social media follower count, the simple video view is vanity metrics. We want our videos to impact our community. We need to push our definition of video program attendance into deeper territory.

You’ll also want to consider whether your library will use a different metric to measure the number of people who attend a live stream virtual program versus a pre-recorded video. My recommendation is to track both numbers separately. This will give you a sense of whether your followers prefer live streaming over pre-recorded video.

When you live stream, you can see right away how many people are “attending” your event. When you finish your live stream on Facebook and Instagram, you’ll have the option of saving your video to your device. Always do that.

Then, you’ll be asked if you want to upload your live stream recording to the platform for on-demand views. You should do that too!

As soon as you end your live stream, Facebook and Instagram both tell you right away the number of people who viewed your live stream. Then you’ll need to decide how often you check the on-demand views of your live stream. You’ll also need to decide how long will you track the on-demand views on each live stream recording.

Make these decisions now so you can consistently report the attendance and compare metrics on videos to see which ones perform best. If you have one type of video program that does well, you should offer more of that!

Once you decide what will count as attendance by one person on each platform, you’re ready to start recording your views. If you are using a social media scheduling platform, this will be easy. Most scheduling platforms have a video performance section that will help you analyze your views. If you can’t find it, go to the “Help” section of your platform. You should also check your scheduling platforms help section to get more information about how they gather those metrics.

If you don’t have a social media scheduling platform, you’ll check the video views on each platform. Here’s how to do that.

Facebook: Go to your library’s page. At the top, under the general Facebook search bar, you’ll see “Insights.” Click on that. Then scroll down the menu on the left side of the page until you see “Videos.” Click on that.

Instagram: You can see how many people viewed your live stream after it’s finished. If you post your live stream to your stories, you can see how many people viewed it. Be sure to check it before the end of your 24 hour period, because it will disappear! If you upload a video to IGTV, you can see how many people viewed the video, but there are no further analytics. You cannot track video views for videos posted to your normal Instagram feed.

Twitter: Go to Google and type “Twitter Analytics.” If you are logged into your library’s Twitter account, the URL will automatically populate with your library’s analytics. At the top of the page, to the right of the Twitter logo, you’ll see the word “More” and a drop-down menu. Click on the arrow to find “Videos.”

YouTube: Go to your channel. Click on YouTube Studio, then Video Analytics.

Side note: You can see my latest book review did not do very well on YouTube. I am comforted by the fact that it was gangbusters on Facebook. And that’s a lesson too. Different videos will work better on different platforms. You’ll learn how to pair a video to a platform by tracking video analytics.

The top three video metrics to track

#1-Video Views

Facebook and Instagram: a view is counted anytime someone watches your video for at least three seconds.

Twitter: a view counts if someone watches at least two seconds. Additionally, at least 50 percent of the tweeted video must be visible on screen to be registered as viewed. This rule is to account for the auto-play function.

YouTube: a view is counted anytime someone watches your video for at least 30 seconds.

#2-Watch Time

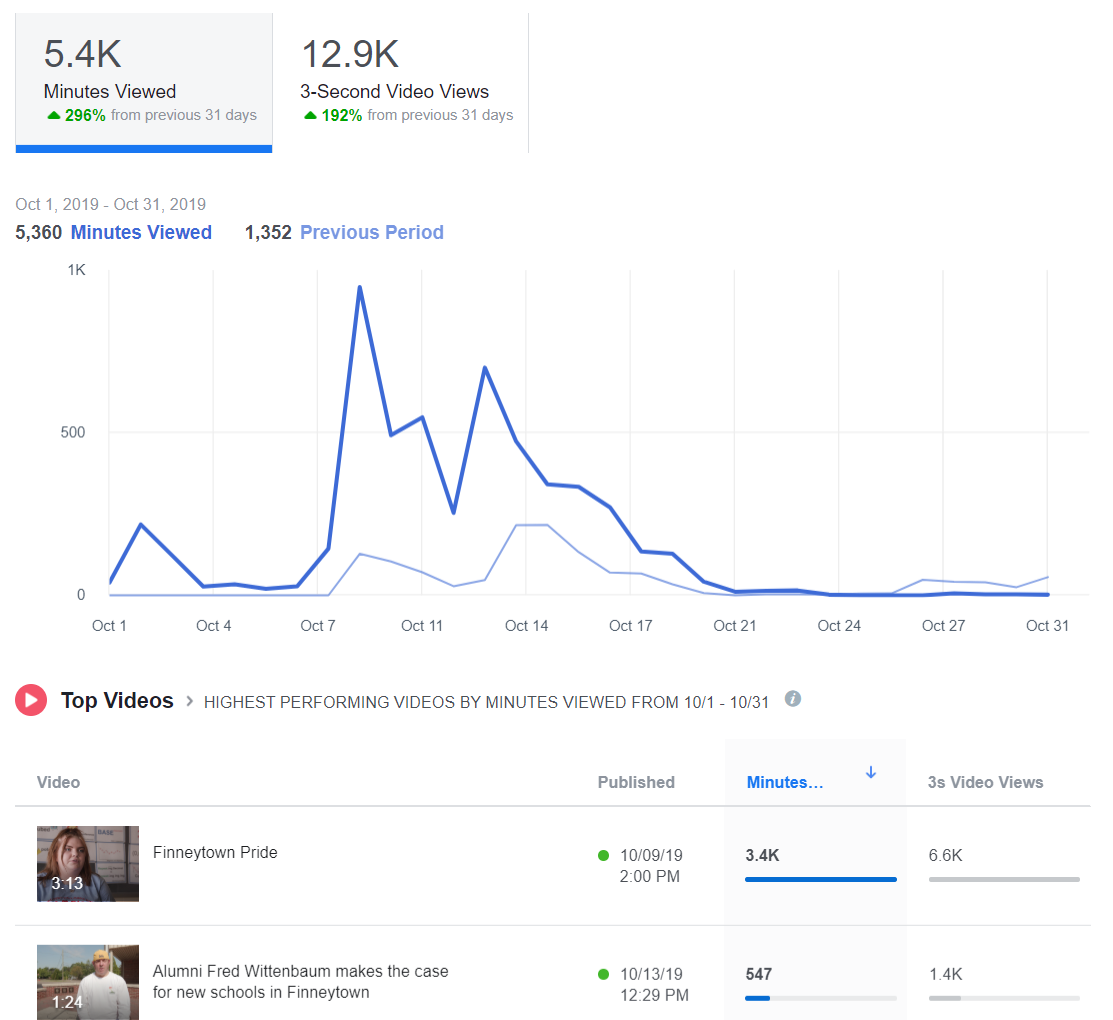
Facebook reports this metric in insights and calls it “minutes viewed.”

Instagram, as far as I can tell at this writing, does not report watch time. (BOO!)

Twitter reports minutes watched under the “video details” of every video you publish on the site. In addition, they have a cool graph that tells you how long the average viewer watches your video. This is reported in quarter percentages. You’ll also get the completion rate, or the percentage of viewers who watched your video from start to finish.

YouTube will tell you the average total watch time for every video you create.

Let’s say you post a 10-minute video on YouTube. You might have 500 views, which means 500 people watched at least the first 30 seconds. Then you’ll have an average watch time of say, 5:33, which means most people watched at least five minutes and 33 seconds of your video.

YouTube prioritizes videos with high watch times in its viewing suggestion algorithm.

I can tell you from my own experience posting The Library Marketing Show to YouTube each week that it’s rare for someone to watch an entire video from start to finish. I challenge myself every week to improve my watch time.

#3-Engagement

As always, you want to record likes, comments, and shares of your videos, as you would with other social media posts. These metrics can tell you how many people were compelled to act based on your video. You can help boost these numbers by actively asking your viewers to like, comment, and share.

Shares are the most important engagement metric, because that means someone liked your online program so much, they wanted their friends and family to enjoy it too.

You might also want to read these⬇️

Videos Can Reach Library Users at Home Now and in the Future. Here’s Your Starter Kit.

The New Guide to Library Marketing Social Media for 2020! Part Four: Maximizing YouTube for Video Plus What About Tumblr, Snapchat, and TikTok?

Subscribe to this blog and you’ll receive an email every time I post. To do that, click on the “Follow” button in the bottom left-hand corner of the page. Connect with me on YouTube, Twitter, Instagram, and LinkedIn.  

I Broke This Library Social Media Rule… and You Should Too!

WATCH NOW

The #LibraryMarketing Show, Episode 42

In this episode, Angela talks about discovering that she was breaking a Twitter Policy Rule repeatedly, for years and years. Hear about why she panicked… and how she figured out it’s actually a good rule to break!

Also Kudos to The State Archives and Records Authority of New South Wales (NSW State Archives and Records) in Australia for their incredible interactive online jigsaw puzzle!  

If you have a topic for the show, kudos to share, or want to talk to me about library marketing, contact me using this short form.

← Back

Thank you for your response. ✨

Want more Library Marketing Show? Watch previous episodes!

Check the Upcoming Events page to see where I’ll be soon. Let’s connect!

This blog consists of my own personal opinions and may not represent those of my employer. Subscribe to this blog and you’ll receive an email every time I post. To do that, click on “Follow” button in the bottom left-hand corner of the page. Connect with me on Twitter, Instagram, and LinkedIn.   

The One Social Media Shortcut That Can Tank Engagement and Cost Your Library in a Pandemic–or Anytime!

I know work is hard right now. But there is one time-saving social media marketing technique that libraries should avoid at all costs.

Libraries should avoid cross-posting on social media. Cross-posting is when you post the same text and graphics in a message across multiple social media networks.

I get why many libraries cross-post. Cross-posting is easy. It saves time and energy. And library staff have a lot of work to do. Even when there is no pandemic to deal with, librarians are often asked to take care of marketing along with their regular duties. But the detrimental effects of cross-posting outweigh any time you might save doing it.

Why cross-posting is a bad idea

Cross-posting is a bad idea because social media platforms are different. They have different standards for post length, image size, hashtags, links, and captions.

For example, LinkedIn is more copy-heavy and formal. Instagram is more visual and informal. Twitter is more suited to short quotes, threads, and GIFs. Pinterest is graphic-heavy. One post with the same text and photo can’t be all those things.

An image you post on one platform may not be sized for another platform. It may end up stretched, pixelated, or squished. This will hurt your ranking and engagement.

Speaking of engagement, the metrics are different for each platform. On Facebook, you’re aiming for likes, comments, and shares. On Twitter, you want retweets and replies. On Pinterest, you want comments and re-pins. One post can’t generate all those things.

Your followers are also different depending on the platform. Twitter users are overwhelming between the ages of 18 and 44. LinkedIn users are more likely to have a college degree than users of other platforms. 70 percent of Pinterest users are women. Every platform has a unique demographic with different needs.

When you cross-post, you risk looking inauthentic and spammy. Your posts will feel like they’re auto generated and robotic. It may look like you don’t care about what you post on your account or worse, that you don’t know you to use social media.

Your audience will respond negatively by not responding at all. That hurts your standing in the algorithm. It can have a negative effect on your reach.

What to do instead

Cross-promotion is better! Take your message and adjust it slightly to suit each social media platform. It’s much easier than it sounds.

First, you need a base message. What is the basic info you wish to convey? What is the action you want your followers to take? Answer these two questions in a two or three sentence nugget. This is your base message.

Then take that base message and adjust it for each of the social media platforms you wish to use. A tweak of a word or phrase here and there, an adjustment of an image, and a unique call to action are all you need to be authentic.

Westerville Public Library in Westerville, Ohio did a great job of tweaking this promotion for Twitter…

…and Facebook.

Here’s another good example of cross-promotion from Barlett Public Library District in Illinois. This is their Twitter post…

..and the same message tweaked for Facebook.

Decide how much time your library is willing to invest on social media. Smaller libraries will want to concentrate on the platform or platforms that will give their library the most benefit. If you are pressed for time, pick the platforms that perform best for you or the platforms where the audience you wish to target is using. If that means you only post on one social media network, it’s okay. Quality is better than quantity.

Use a scheduling tool. There are plenty of free scheduling tools that will help you to share your social media messages without cross-posting. I have used the free version of TweetDeck for my personal social media for years. You can schedule lots of posts in advance and the metrics are great. I recommend it for libraries without the budget for scheduling software.

At my former library job, we had a paid account with Sprout Social. It was easy to use and had more cross promotion capabilities than TweetDeck. I recommend it if you have money for a paid scheduling platform.

More library social media advice

How #COVID-19 is Impacting Social Media Marketing and What That Means for Libraries

Self-Care for Library Social Media Staff in the Midst of a Crisis like #COVID-19

What Metrics Demonstrate Your Library’s Social Media Marketing is Working?

How to Reverse Engineer Your Library Marketing Social Media Audiences!

Subscribe to this blog and you’ll receive an email every time I post. To do that, click on the “Follow” button in the bottom left-hand corner of the page. Connect with me on YouTube, Twitter, Instagram, and LinkedIn.  

Self-Care for Library Social Media Staff in the Midst of a Crisis like #COVID-19

Watch Now

In this episode, Angela shares tips for self-care for anyone who is trying to manage a library social media account in the midst of a crisis, like a global pandemic.

More Help

Library Marketing During a Pandemic: Tips for Working from Home or the Office and Dealing with the Stress of a Crisis

How Libraries Are Responding to the Coronavirus Threat and How Your Library Can Prep for Any Crisis

Plus kudos go out this week to the Lake Macquarie Library system in Australia. They have a new app and it’s pretty darn amazing.

Subscribe to this series to get a new video tip for libraries each week!

If you have a topic for the show, kudos to share, or want to talk to me about library marketing, contact me using this short form.

← Back

Thank you for your response. ✨

Want more Library Marketing Show? Watch previous episodes!

Check the Upcoming Events page to see where I’ll be soon. Let’s connect!

This blog consists of my own personal opinions and may not represent those of my employer. Subscribe to this blog and you’ll receive an email every time I post. To do that, click on “Follow” button in the bottom left-hand corner of the page. Connect with me on Twitter, Instagram, and LinkedIn.   

Stats to Consider Before Your Library Dumps Facebook!

The Library Marketing Show: Episode 33

WATCH NOW

In this episode, we talk about a hot button issue: deleting your library’s Facebook account.

Many libraries are thinking about quitting Facebook for a variety of reasons. In this episode, we go over a few key Facebook statistics to consider before you make a decision. NO JUDGEMENT HERE! Stats are courtesy of Social Media Today.

Also kudos to the Evanston Public Library for their brand-new podcast. It’s getting great buzz and I can’t wait to listen. Read more about the podcast here. And, if you want to start your own, here’s some advice from a library podcast expert.

If you have a topic for the show, kudos to share, or want to talk to me about library marketing, email me at ahursh@ebsco.com.

Want more Library Marketing Show? Watch previous episodes!

Check the Upcoming Events page to see where I’ll be soon. Let’s connect!

Subscribe to this blog and you’ll receive an email every time I post. To do that, click on “Follow” button in the bottom left-hand corner of the page. Connect with me on Twitter, Instagram, and LinkedIn.  

What Metrics Demonstrate Your Library’s Social Media Marketing is Working?

The Library Marketing Show: Episode 32

WATCH NOW

In this episode, we answer a question from Tiffani from the St. Charles City-County Library. She asked, “What analytics are the most helpful to determine if social media is working?”

Angela shares the three big measures of success and ONE metric that doesn’t mean much anymore!

Also kudos go out to libraries taking part in the Dolly Parton meme. Find out why this fun project is so important to library marketing.

If you have a topic for the show, kudos to share, or want to talk to me more about library marketing, email me at ahursh@ebsco.com.

Want more Library Marketing Show? Watch previous episodes!

Check the Upcoming Events page to see where I’ll be soon. Let’s connect!

Subscribe to this blog and you’ll receive an email every time I post. To do that, click on “Follow” button in the bottom left-hand corner of the page. Connect with me on Twitter, Instagram, and LinkedIn.  

Show, Don’t Tell: Why Infographics are an Essential Component in Your Library Marketing

Infographics are visual marketing pieces that help explain facts and figures or lay out a complex set of information in a way that is easy to understand. They’re an incredibly effective marketing tactic.

Until recently, I thought infographics were a relatively new marketing tactic. I remember deciding in 2013 to create an infographic, the first for my library, to promote a readalikes list. I thought I was so innovative!

Turns out, infographics have been around for hundreds of years. Fun fact: The first known instance of infographics as we know them today dates to the late 1700s with a chart of wheat process and labor wages.

Frankly, I love infographics. They appeal to my visual and creative nature. They work well on social media. But they take a lot of time and planning. So, for libraries with a limited marketing staff, it can seem daunting to create one. But it’s worth it.

Why use infographics in library marketing?

Infographics grab attention. Our brains are hard wired for visuals. The human eye can process 36,000 visual messages per hour. That’s 60,000 times faster than the brain can process text. 60,000 times. Whoa.

A good infographic will trigger a reaction in the human brain, sometimes even before the person consciously realizes and processes that reaction.

Think about what happens to you when you see a photograph of a beloved family member or friend. The photo instantly makes you cry, laugh, or long for that person to return to your life. An infographic can trigger the same kind of emotional response. And emotional responses are the best kind of marketing, because they are memorable.

Infographics can explain complex ideas and convey a lot of information in a simple way that is accessible to many audiences. Libraries deal with a lot of data. Our products and services are sometimes difficult to break down into steps. A good infographic will take facts and figures, difficult instructions, or confusing concepts and present them in a way that everyone can understand.

Infographics will position your library as an expert in a way that words can’t. A good visual will demonstrate your library’s subject-matter expertise. It can boost your credibility. It shows that you care about effective communication with your community. And that builds trust with your visitors, community members, and stakeholders in a way that feels more genuine that fancy words.

Three ways to use infographics in your library marketing

Promote your collection. Use infographics to promote a themed collection series, such as new dystopian fiction, the best book club reads, or mystery authors.

You can recruit your collection development department to come up with a list or, if your library is a NoveList client, you can use the NoveList database to find books within a theme. Use the infographic to drive traffic to those titles in your catalog. This works really well on social media.

Explain difficult information. Create an infographic to help you explain something to your cardholders, like how to download an eBook, how to pay a fine, how your library uses taxpayer funding, or why summer reading is vital to childhood literacy.

Infographic template from LibraryAware

Show that your library is fun! Have your content team come up with a great idea for a fun promotion, like 20 signs that you might be a bookworm or how to make a bookmark out of an old book.

How to design a library marketing infographic

Create an outline. An outline can help you to lay out the pieces of the infographic and cut your ideas down to the essential elements.

Decide which points are essential for getting your message across. Is there a story to be told in the data or concept you are trying to convey? Is there a beginning, a middle, and an end to that story?

Once your outline is set, your other design elements will become clear to you. What is your theme? Will you use charts or graphics, lists or numbered elements, photos, shapes, or icons? Write those decisions down next to each section in the outline to help you organize your thoughts.

Plan your layout. You’ll want to make sure all the elements of your infographic are balanced. But that doesn’t mean everything has to be symmetrical!

For instance, if your infographic is explaining something that has a lot of considerations at the beginning of the process and works toward one end result, you could consider a funnel-design: making the number of visuals heavy at the top and lighter as the eye moves down.

If you are explaining something on a timeline, you can arrange your elements evenly from top to bottom but not directly across from one another.

It’s good to sketch your layout out before you go into a design program. This saves time in the actual process of creation and gives you space to make changes at a stage where it’s easy to fix.

You will also want to plan out any places in your infographic where you might need a visual break, like a solid block of color or a line or shape. Finally, be sure to leave white space. You want your infographic to look uncluttered.

Decide your color scheme. A good rule of thumb is to design your infographic with two or three main colors. Then choose a few minor color accents.

The subject of your infographic will have a bearing on your color decision. Some colors work better for explaining data, and some work better for explaining processes.

Infographic template in LibraryAware

Take your branding into consideration when you decide on your color scheme, to avoid clashing with your logo.

Pick your fonts. You’ll want to make sure your type is accessible to all audiences. Avoid script-type fonts. Keep in mind that an infographic is visual, and the amount of text will be minimal, so the font you choose must compliment the design elements of the infographics.

Limit your use of fonts to just two or three types. It’s good design to pick a font for the header, one for the main body text, and a third for the complimentary or subtext.

Write a headline that hooks your target audience. As you would with emails or blog articles, the headline or title of your infographic will need to convey the general theme of your visual and catch the attention of your potential audience. Be descriptive and catchy. The title should be shorter than a headline you may use for other content—only a few words long.

Subscribe to this blog and you’ll receive an email every time I post. To do that, click on the “Follow” button in the bottom left-hand corner of the page. Connect with me on YouTube, Twitter, Instagram, and LinkedIn.  

How to Reverse Engineer Your Library Marketing Social Media Audiences!

The Library Marketing Show: Episode 29

WATCH NOW

A Library Marketing show viewer recently asked me: Do you target specific audiences with different social media venues?

I do, but I reverse engineer it! I’ll explain in this video.

Also, kudos go out to Cesar from the Austin Public Library in Austin, Texas. He wrote an article in the Texas Library Journal on the topic of social media ambassadors, how they work and why your library needs them. We hear a lot about using influencers on social media but the traditional influencer model doesn’t really work for libraries. And this is a version that will work. These are volunteers who willingly help promote your library on their personal social media channels. We know social proof is really important in social media promotion-that idea that other people are really into this one particular thing, your library because it gives people FOMO and a sense that they might be missing out if they don’t get in on some library action! Cesar lays out how his library recruits and uses ambassadors and how they’ve helped the Austin Public Library.   

Want more Library Marketing Show? Watch previous episodes!

Check the Upcoming Events page to see where I’ll be soon. Let’s connect!

Subscribe to this blog and you’ll receive an email every time I post. To do that, click on “Follow” button in the bottom left-hand corner of the page. Connect with me on Twitter, Instagram, and LinkedIn.  

A WordPress.com Website.

Up ↑