
Use the feedback button to share your most pressing email marketing question. I’ll answer these in a future blog post!
I love opening the “reports” tab on an email platform. There is a second or two of anticipation as the page loads that brings me a thrill.
What will the numbers say? Will they be better or worse than last month? Will they reveal a new trend that I can use to better serve my target audience?
I realize I sound a little nuts. But honestly, I love metrics.
They are clear and concise. They show you what’s working and what’s not working. They give you permission to stop doing promotions that don’t help your library at all. If you try something new, they’ll tell you whether your idea worked or not.
Tracked over time, email metrics will help you to take the 30,000-foot view of your library marketing. You can see if your emails are doing what they are supposed to do… moving your library toward its overall strategic goals.
There is a lot we could measure in terms of email marketing. It would be easy to get lost in the quagmire of numbers and analysis.
So, I want you to focus on four data points that really matter to library email marketing. Use these metrics to determine whether your messages are connecting with your audience and promoting your library’s overall strategic goals. And don’t miss the bonus tip at the end of this list!
“Email is the only place where people, not algorithms, are in control.”
Ann Handley, writer, digital marketing pioneer, and Wall Street Journal best-selling author
1. Increase of raw circulation numbers.
Record the number of checkouts and holds before you send the message and then again after the message is sent. You can generally wait about three days to check those numbers. Cardholders who want to act on an email will do so within a three-day period of receiving it.
What this metric will tell you: Raw circulation numbers will likely be of interest to anyone in collection development at your library. They are also the basis for the next two metrics, which will help you compare the effectiveness of your emails.
2. Percentage increase in circulation.
Once you start collecting data on raw holds and checkout increases, you will want to calculate the percentage increase in circulation.
Let’s say on Monday, you send an email promoting one specific eBook. Before you send the email, you note that there are currently three holds or checkouts of this eBook. When you check on Tuesday, there are four new holds or checkouts placed on the eBook. In total, there are now seven holds or checkouts on this item.
Use percentagecalculator.net to calculate the percentage increase in circulation. For this example, we use the third calculation tool on the page:

That’s a 133 percent increase in circulation.
Now, the next week, you decide to send another email promoting a different eBook. But this time, the eBook you choose to promote has 15 holds or copies before the email is sent. When you check 24 hours after sending the email, there are 10 new holds or checkouts. In total, there are now 25 holds or checkouts on the eBook.
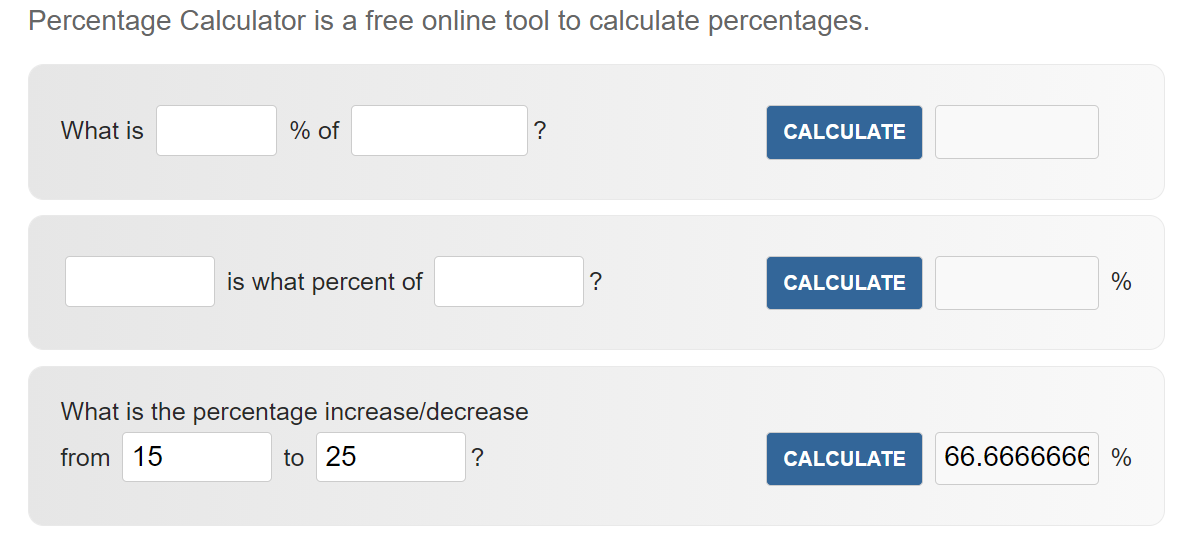
The raw numbers for the second email are bigger (an increase of 4 holds/checkouts vs. an increase of 10 holds/checkouts). But the percentage increase for the second email is actually smaller, at 66%! That means email #1 was more effective.
What this metric will tell you: Percentage increase in circulation lets you compare your promotions more accurately. If you are short on time, this kind of comparison will help you determine which promotions will give you the most success with your limited resources.
3. Conversion rate.
This is the percentage of people who took an action after receiving your email.
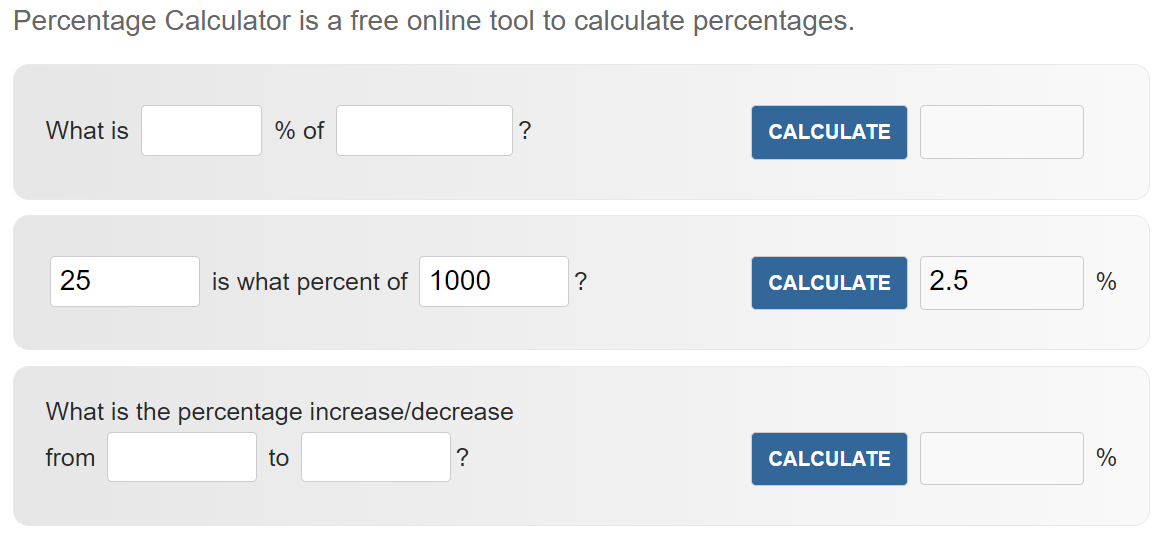
Let’s pretend that you’ve sent an email to 1000 people. The email promotes a streaming video on your library website that hasn’t had any views in the past couple of weeks.
When you check the streaming statistics for that video, you see that 25 people watched the video in the days immediately after you sent the email.
Using the second tool on our percentage calculator website, you can calculate the percentage of people who “converted” or took an action after your email.
What this metric will tell you: If you start tracking conversion rates on your emails, over time you’ll have a clear picture of the types of emails your audience responds to. You’ll be able to establish a good base percentage for your audience. This number will be different for every library.
If you are short on time, this metric will help you determine which promotions will give you the most success with your limited resources. When you find a certain type of email promotion works based on conversion rate, you should do it more often.
4. Amount of traffic driven to your website.
Track how much traffic is funneled to your public website by your emails. You can use Google Analytics to analyze how efforts on those platform translates into action by your cardholders. If you’ve never worked with Google Analytics, here is an easy guide to get you started.
What this metric will tell you: This is an important metric to share with administration, because it clearly demonstrates the value of the time and energy you have invested in email marketing.
Special bonus tip!
If you promote the same collection item or booklist on social media, email, and your website, put some space between those three promotions. A week is a good amount of time. That allows you to really pinpoint whether your increase in circulation is coming from email, your placement of the item on your website, or social media.
In fact, that’s a fun experiment to run. Can you drive higher circulation numbers by promoting your collection on your website, email, or social media?
You can even get more granular: which social media platform is best for collection promotion? Which page on your website is best for placing collection promotions? Which email list responds best? See, this is fun!
Subscribe to this blog and you’ll receive an email every time I post. To do that, click on the “Follow” button in the bottom left-hand corner of the page.
You may also like these articles
Are My Library Email Metrics Good…. or Bad?! Here Are the Latest Stats to Help You Figure It Out.
What Metrics Demonstrate Your Library’s Social Media Marketing is Working?
Angela’s latest book review
Beautiful Things by Hunter Biden

July 12, 2021 at 9:24 am
This is def the MOST important thing to look at – conversion!!! If anyone could do this automatically they’d make a mint! Is anyone doing this automated now?
LikeLiked by 1 person
July 12, 2021 at 11:30 am
Not that I’m aware of, Chris!
LikeLiked by 1 person